

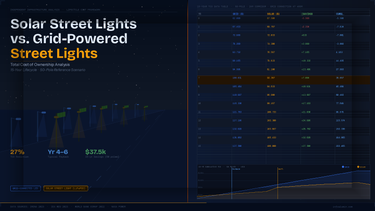
Solar Street Lights vs. Grid-Powered Street Lights: A Full Lifecycle TCO Analysis for Municipal Procurement
Introduction
Municipal lighting budgets are under pressure. As cities expand into peri-urban and rural corridors, procurement managers increasingly face a binary decision: extend the grid or deploy solar. The wrong choice can result in cost overruns exceeding 40% of the original capital estimate over a 15-year asset life. This article provides a structured Total Cost of Ownership (TCO) framework—covering capital expenditure, operating costs, maintenance, and payback logic—to help engineers and procurement managers make a defensible, data-backed decision before specifications are locked.
The Decision Context: Why TCO Matters More Than Sticker Price
Grid extension and solar street lighting look very different on a purchase order. A grid-connected LED street light fixture may cost $150–$400 per unit; a comparable all-in-one solar street light may cost $350–$900 per unit depending on battery capacity, panel wattage, and control system. On a line-item budget, the solar option often appears more expensive.
However, unit price comparisons are structurally misleading for infrastructure assets. The International Renewable Energy Agency (IRENA) notes in its Renewable Power Generation Costs 2023 report that upfront capital cost represents only a fraction of lifecycle expenditure for off-grid energy systems—operational and financing costs frequently dominate over a 10–20 year horizon.
The real decision variables are:
- Distance from the nearest grid connection point — civil and cable costs escalate non-linearly beyond 500 meters
- Local electricity tariff trajectory — IEA's World Energy Outlook 2023 projects continued volatility in commercial electricity prices across Southeast Asia, Sub-Saharan Africa, and Latin America
- Maintenance access and labor cost — for road corridors in low-density or remote areas, corrective maintenance per event can cost 3–8× more than in urban centers (World Bank ESMAP, Off-Grid Solar Market Trends Report, 2022)
- Project funding structure — grant-funded projects may weight CAPEX differently than municipal bond-financed ones
A proper TCO analysis normalizes these variables across a common timeframe—typically 15 years, aligned with LED and LiFePO₄ battery rated service life assumptions.
CAPEX Comparison: Solar Street Light vs. Grid-Connected Street Lighting
Grid-Connected Street Light: What Goes Into the Capital Budget
The fixture price is only one line item. A complete grid-powered installation typically includes:
- Trenching and conduit: $15–$60 per linear meter depending on soil condition and road surface type
- MV/LV cable: $8–$25 per meter for 4-core armored cable (market pricing, 2023–2024)
- Transformer and distribution cabinet: $3,000–$12,000 per feeder zone (amortized across poles)
- Pole and foundation: $200–$600 per point depending on height and wind load class
- Fixture (LED luminaire): $150–$400 per unit, 70W–150W typical for arterial roads
For a 1-kilometer road corridor with poles spaced at 35-meter intervals (approximately 29 poles), grid infrastructure CAPEX excluding the luminaire commonly ranges from $18,000 to $55,000 depending on trench distance and local civil costs. This figure does not appear in the fixture unit cost but is fully attributable to the project.
Solar Street Light: Bundled CAPEX Structure
An all-in-one solar street light consolidates the panel, battery, controller, and luminaire into a single pole-mounted assembly. Per-unit installed costs typically range:
- Entry-level (60–80W equivalent output, 1–2 night autonomy): $400–$650 installed
- Mid-range (80–120W equivalent, LiFePO₄, 3-night autonomy): $700–$1,100 installed
- High-specification (120W+ equivalent, 5-night autonomy, smart dimming): $1,100–$1,800 installed
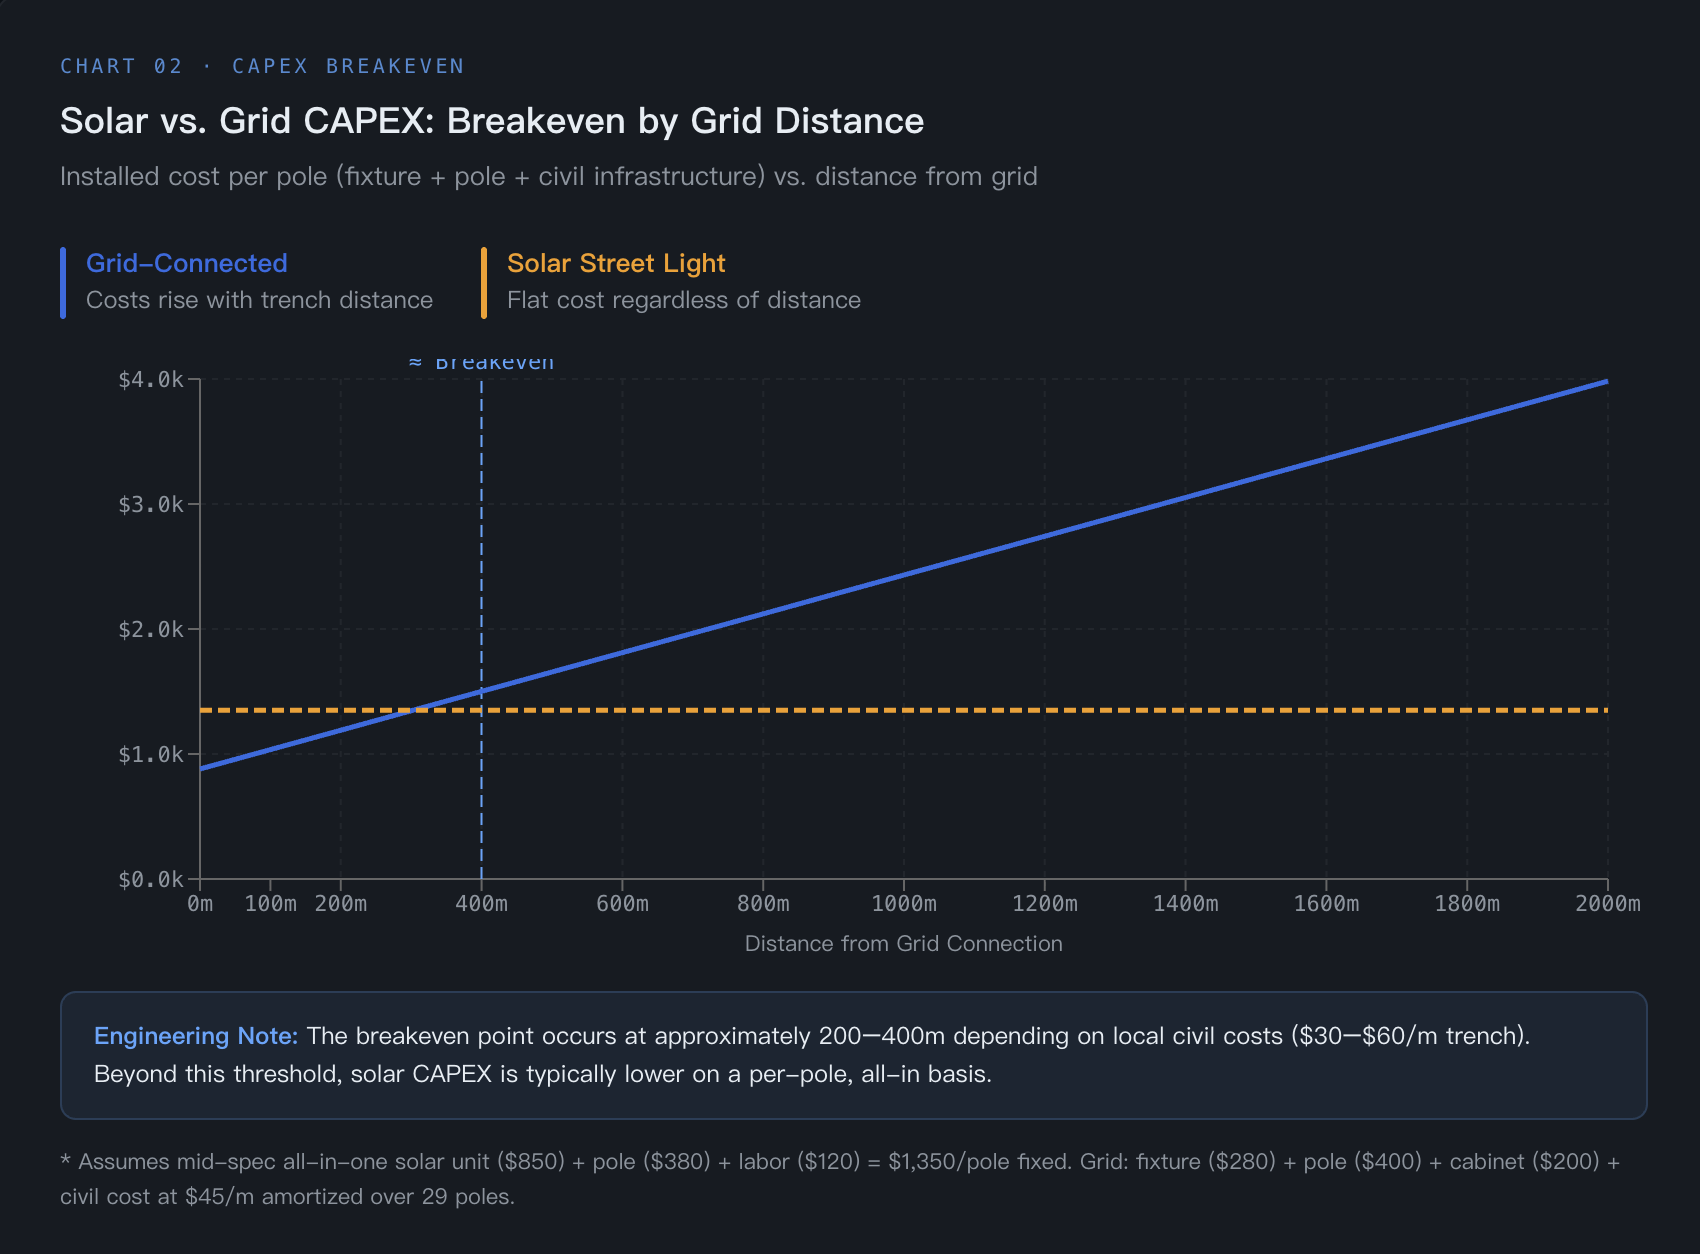
Critically, no grid infrastructure cost is incurred. Foundation and pole costs are similar to grid systems. The CAPEX breakeven point at which solar total installed cost matches grid total installed cost (fixture + infrastructure) typically occurs when grid extension distance exceeds 200–400 meters per pole, depending on local civil rates.
OPEX and Maintenance: Where the Numbers Diverge Over Time
Energy Cost: Grid-Powered Systems
Grid-connected street lights consume electricity continuously billed at commercial or public lighting tariffs. Using a 100W luminaire operating 11 hours per night (4,015 hours/year):
Annual energy consumption per point: 100W × 4,015h = 401.5 kWh/year
At a commercial tariff of $0.10/kWh (representative of lower-tariff markets in Southeast Asia and parts of Africa), this equals $40.15/unit/year. At $0.15/kWh (Eastern Europe, Latin America), the figure rises to $60.23/unit/year.
Over 15 years, at a modest 3% annual tariff escalation, the cumulative energy cost per luminaire ranges from approximately $740 to $1,120, depending on tariff level.
Energy Cost: Solar Street Lights
Solar street lights generate their own energy. Ongoing energy cost is effectively zero, subject to adequate solar resource. NASA POWER data confirms that most tropical and subtropical regions (15°N–35°N latitude bands, including North Africa, South/Southeast Asia, and Central America) receive 4.5–6.5 peak sun hours (PSH) per day on an annual average basis, which is sufficient to support full-night lighting with appropriately sized battery systems.
The relevant OPEX for solar systems is battery replacement, which is the single largest recurring cost variable.
Battery Replacement Cost
LiFePO₄ (lithium iron phosphate) batteries, which have become the industry standard for solar street lights, are rated for 2,000–3,000 cycles at 80% Depth of Discharge (DoD) in controlled conditions, corresponding to a field service life of approximately 6–8 years under typical cycling patterns (IEEE reference: Life cycle analysis of LiFePO₄ cells for stationary storage applications, various 2019–2022 studies). This implies one battery replacement cycle within a standard 15-year project horizon.
Battery pack replacement costs typically run $80–$200 per unit (factory cost basis), plus labor. In accessible urban environments, total replacement cost may be $120–$280 per unit. In remote areas with high mobilization cost, this figure can reach $350–$500 per unit.
Maintenance and Fault Response
Grid-connected systems require electrical fault diagnosis involving both the luminaire and the upstream supply circuit. When cable faults, circuit breaker trips, or transformer issues occur, repair times and costs are substantially higher than for self-contained solar units.
Typical corrective maintenance cost benchmarks (World Bank ESMAP, 2022):
| Maintenance Event | Grid System (per event) | Solar System (per event) |
|---|---|---|
| Lamp/driver replacement | $30–$80 | $30–$80 |
| Cable fault repair | $200–$1,500+ | N/A |
| Controller/sensor fault | $50–$150 | $40–$120 |
| Battery replacement | N/A | $120–$500 |
| Annual inspection per pole | $15–$40 | $10–$30 |
Solar systems eliminate cable fault risk entirely and simplify fault isolation to the individual pole level.
Payback Period and 15-Year TCO Calculation
Structured TCO Calculation Example
The following example uses publicly defensible assumptions to illustrate the TCO methodology. Procurement teams should substitute local values for each variable.
Scenario: 50-pole road lighting project, 2 km corridor, 400 m from grid connection point. Location: tropical region, 5.2 PSH/day average (NASA POWER, representative of peninsular Southeast Asia). Local electricity tariff: $0.12/kWh, escalating at 3%/year. Labor mobilization cost: moderate (accessible paved road).
Assumptions are explicitly stated; actual project values will vary.
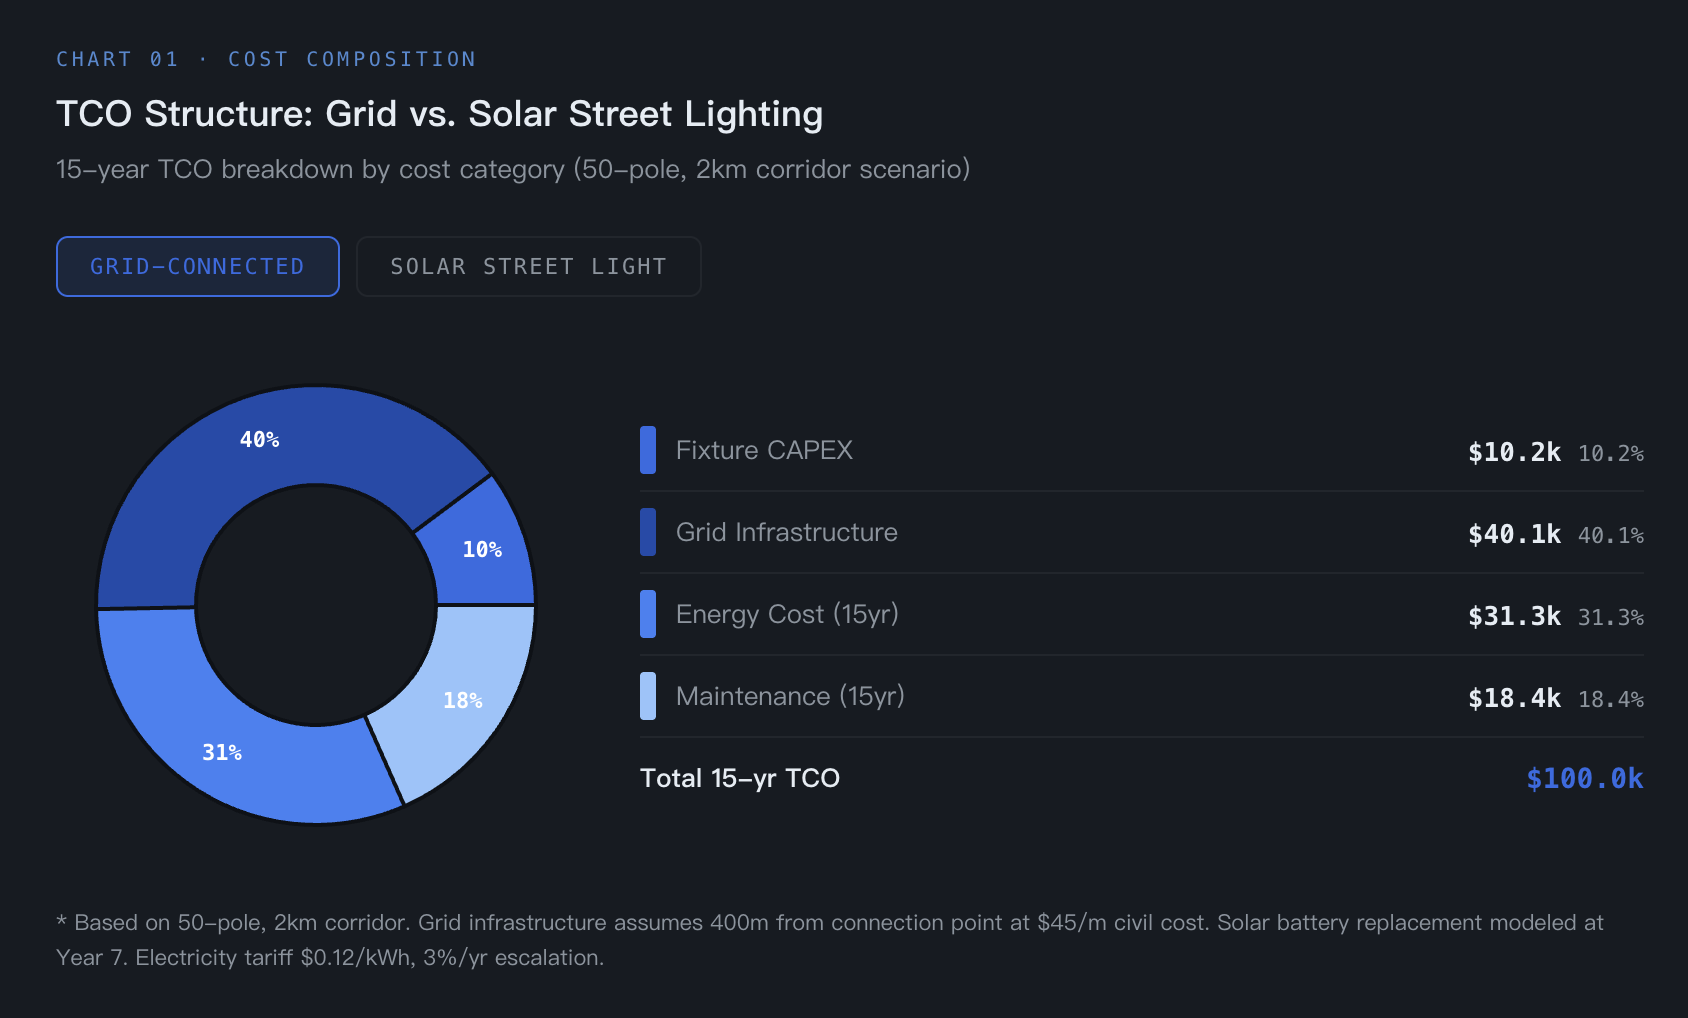
Grid-Connected Option – 15-Year TCO (50 poles)
| Cost Item | Unit Cost | Total (50 poles) |
|---|---|---|
| Luminaire (100W LED) | $280 | $14,000 |
| Pole + foundation | $400 | $20,000 |
| Trenching (400m @ $30/m) | — | $12,000 |
| Cable (400m @ $15/m) | — | $6,000 |
| Distribution cabinet (amortized) | $200/pole | $10,000 |
| CAPEX Subtotal | $62,000 | |
| Energy (15yr, 3% escalation, $0.12/kWh) | ~$860/pole | $43,000 |
| Scheduled maintenance (15yr) | $400/pole | $20,000 |
| Corrective maintenance estimate | $250/pole | $12,500 |
| OPEX Subtotal (15yr) | $75,500 | |
| Total 15-Year TCO | $137,500 | |
| Per-pole TCO | $2,750 |
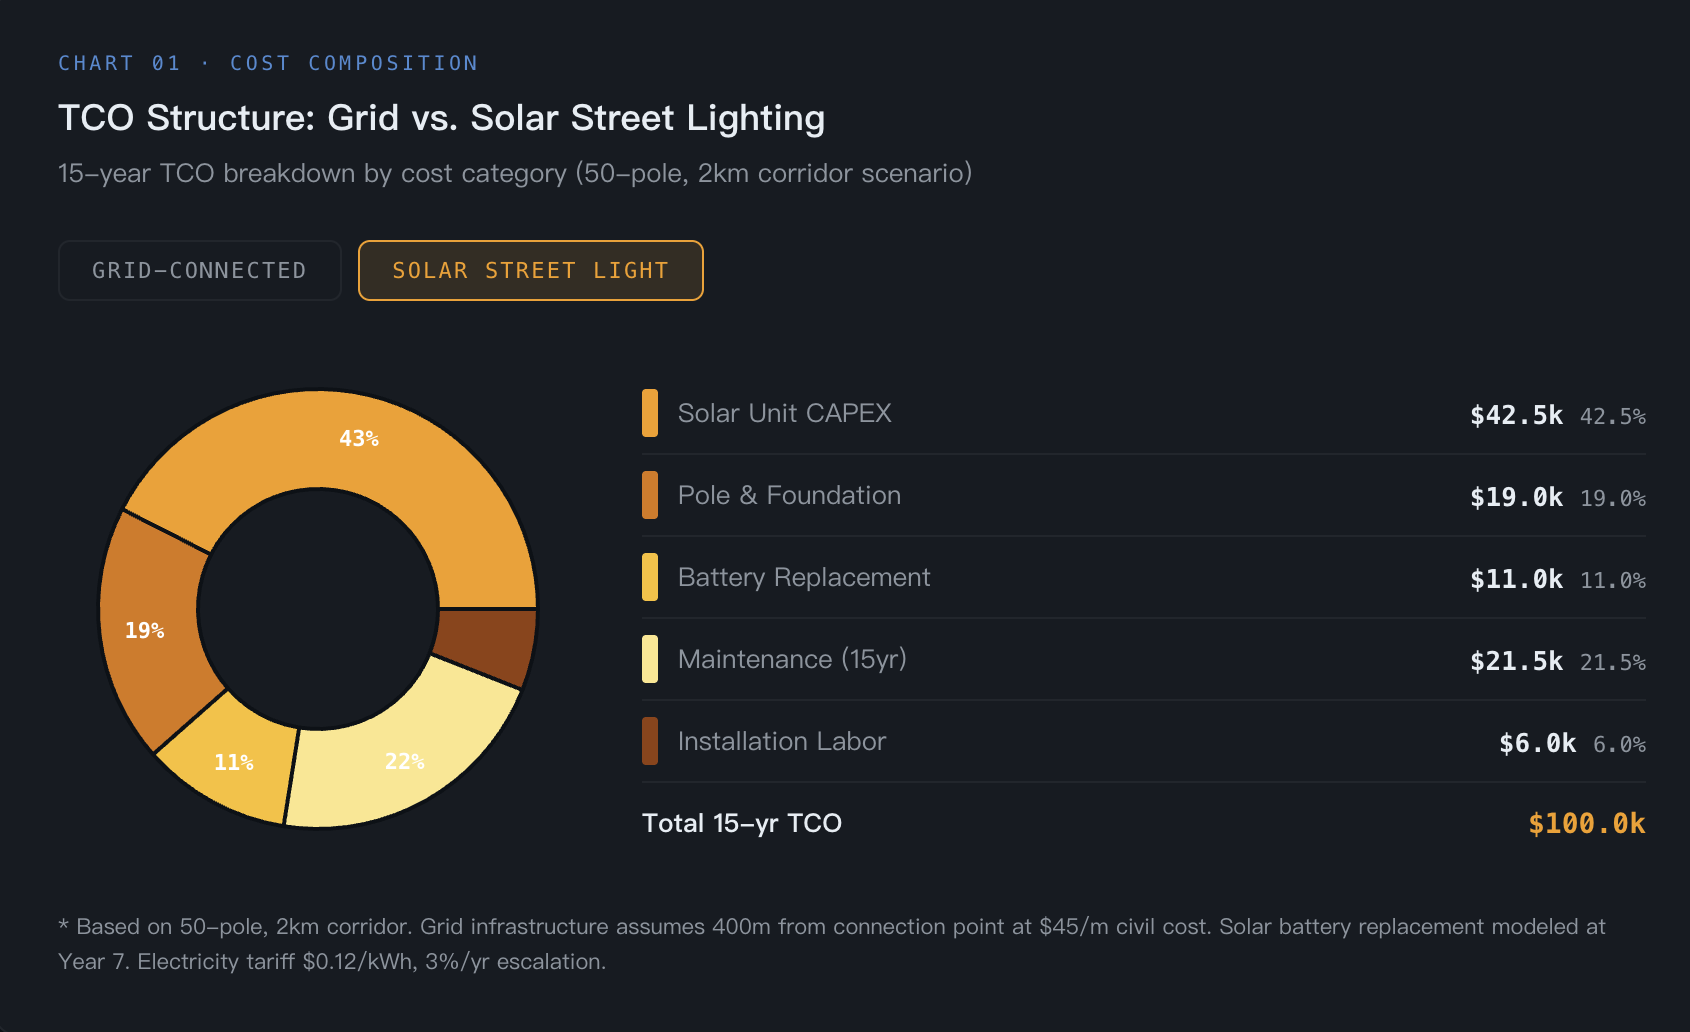
Solar Street Light Option – 15-Year TCO (50 poles)
| Cost Item | Unit Cost | Total (50 poles) |
|---|---|---|
| All-in-one solar unit (mid-spec, LiFePO₄) | $850 | $42,500 |
| Pole + foundation | $380 | $19,000 |
| Installation labor | $120/pole | $6,000 |
| CAPEX Subtotal | $67,500 | |
| Energy cost | $0 | $0 |
| Battery replacement (yr 7, est.) | $220/pole | $11,000 |
| Scheduled maintenance (15yr) | $280/pole | $14,000 |
| Corrective maintenance estimate | $150/pole | $7,500 |
| OPEX Subtotal (15yr) | $32,500 | |
| Total 15-Year TCO | $100,000 | |
| Per-pole TCO | $2,000 |
Result: Under these assumptions, the solar option delivers a 27% lower 15-year TCO ($100,000 vs. $137,500) despite a higher per-unit purchase price. The simple payback on the CAPEX premium over grid OPEX savings occurs at approximately year 5–6.
When grid connection distance drops below 100 meters and local electricity tariffs are below $0.08/kWh, the grid-connected option may retain lifecycle cost advantage. Engineers should model both scenarios with local inputs before finalizing specifications.

Decision Support: Comparative Framework and Procurement Checklist
Head-to-Head Comparison: Solar vs. Grid Street Lighting
| Evaluation Dimension | Grid-Connected LED | Solar Street Light (LiFePO₄) |
|---|---|---|
| Upfront cost (fixture only) | Lower | Higher |
| Infrastructure CAPEX | High (trenching, cable, transformer) | Minimal |
| Annual energy cost | $40–$120/pole/year | Effectively zero |
| Grid dependency | Full | None |
| Battery replacement cycle | N/A | Every 6–8 years (LiFePO₄) |
| Fault isolation | Circuit-level (complex) | Pole-level (simple) |
| Suitable for remote/off-grid areas | Not viable beyond ~500m | Well-suited |
| Suitable for high-density urban areas | Cost-effective | Cost depends on tariff |
| Smart control compatibility | Yes (DALI, Zhaga) | Yes (built-in PIR, dimming) |
| Applicable standard references | EN 13201, IEC 60598 | IEC 62133, IEC 61427 |
| Typical project payback vs. baseline | — | 4–8 years (varies by scenario) |
| 15-year TCO (representative scenario) | Higher in low-density corridors | Lower in off-grid or remote settings |
Procurement Checklist for Solar Street Light Evaluation
Before committing to solar street lights in a public tender, procurement managers should verify:
- Solar resource adequacy: Has NASA POWER or PVGIS data been used to confirm minimum 4.0 PSH/day annual average for the project location?
- Autonomy days specified: Does the specification require a minimum 2–3 consecutive cloudy days of battery backup at 50% rated output?
- Battery chemistry confirmed: Is LiFePO₄ chemistry explicitly specified? (Avoid lead-acid or NMC lithium for outdoor cycling applications)
- Battery cycle life warranty: Does the supplier warrant ≥2,000 cycles at ≥80% capacity retention? Is this documented in the bid?
- IP and IK ratings verified: Are luminaire and battery enclosure rated to minimum IP65 and IK08 per IEC 60529 and EN 62262?
- Driver efficiency: Is the LED driver efficiency ≥92% at rated load, with power factor ≥0.95?
- Lumen maintenance: Does the specification require L70 ≥50,000 hours per IES LM-80 data?
- Smart dimming logic defined: Is the dimming schedule (e.g., 100% 18:00–23:00, 50% 23:00–05:00) specified in the contract?
- Warranty terms: Are panel (≥10 years), battery (≥5 years), and luminaire (≥5 years) warranties separately stated?
- TCO model submitted: Is the bidder required to submit a 15-year lifecycle cost model as part of the technical proposal?
Conclusion
When a project involves road corridors more than 300–500 meters from an existing grid connection point, or when local electricity tariffs exceed $0.10/kWh with an upward trajectory, solar street lighting typically delivers a lower 15-year total cost of ownership than grid-connected alternatives—even accounting for battery replacement. The CAPEX premium of solar systems is generally recovered within 5–8 years through eliminated energy and infrastructure costs.
For high-density urban projects with grid infrastructure already in place, the analysis shifts: grid-connected systems may retain cost advantage, and the decision should be driven by a site-specific TCO model rather than general rules of thumb. The framework presented here provides a replicable methodology that procurement managers can adapt to local conditions.
If you require a outdoor LED lighting system configuration assessment tailored to your project's solar resource, load profile, and budget structure, Infralumin technical team is available to provide a customized analysis.
References
- IRENA · Renewable Power Generation Costs 2023 · 2024 · irena.org
- IEA · World Energy Outlook 2023 · 2023 · iea.org
- World Bank ESMAP · Off-Grid Solar Market Trends Report 2022 · 2022 · esmap.org
- NASA POWER · Climatology Data Access Tool (Surface solar radiation, PSH by location) · power.larc.nasa.gov
- PVGIS · European Commission Joint Research Centre, Photovoltaic Geographical Information System · re.jrc.ec.europa.eu/pvg_tools
- IEEE / Academic reference direction · LiFePO₄ battery cycle life analysis for stationary and outdoor applications · Multiple studies, 2019–2022 (Google Scholar: "LiFePO4 cycle life outdoor storage")
- IEC 62133 · Safety requirements for portable sealed secondary cells and batteries · International Electrotechnical Commission
- IEC 61427 · Secondary cells and batteries for photovoltaic energy systems · International Electrotechnical Commission
- EN 13201 · Road lighting standard · European Committee for Standardization
- IEC 60598 / IEC 60529 · Luminaire construction and IP rating classification · International Electrotechnical Commission

Zhongshan Lumin Technology Co., Ltd. is a renowned high-tech enterprise specializing in the research, development, and manufacturing of industrial LED lights.
Contact
@2026 Zhongshan Lumin Technology Co., Ltd.