

The Ultimate Engineering Guide to Solar Street Light Sizing: Formulas, Calculations & Free Sizing Sheet
A solar street light that works in a sales demo can go dark in its first rainy season. The cause is rarely a bad LED or cell. It is usually a sizing error: designing on annual-average sun instead of the worst month, on nameplate watts instead of the real load, or on a positive daily balance instead of the time the battery needs to recover after cloudy weather.
This guide gives a practical, recovery-driven method for estimating panel, battery and MPPT requirements, with a worked example and a three-city comparison. Treat the results as an initial engineering estimate and verify them against site conditions and equipment datasheets.
Load → worst-month sun → panel (daily balance and recovery) → battery (autonomy) → DoD and recovery checks → MPPT controller.
1. Convert lumens to design power
P = Φ ÷ η_lm
For an 8,000 lm luminaire at an assumed 200 lm/W: 8,000 ÷ 200 = 40 W. Treat 200 lm/W as a design assumption. Where available, use the measured DC input power of the whole luminaire. An optimistic efficacy does not reduce the energy the battery must supply.
2. Calculate daily battery-side energy
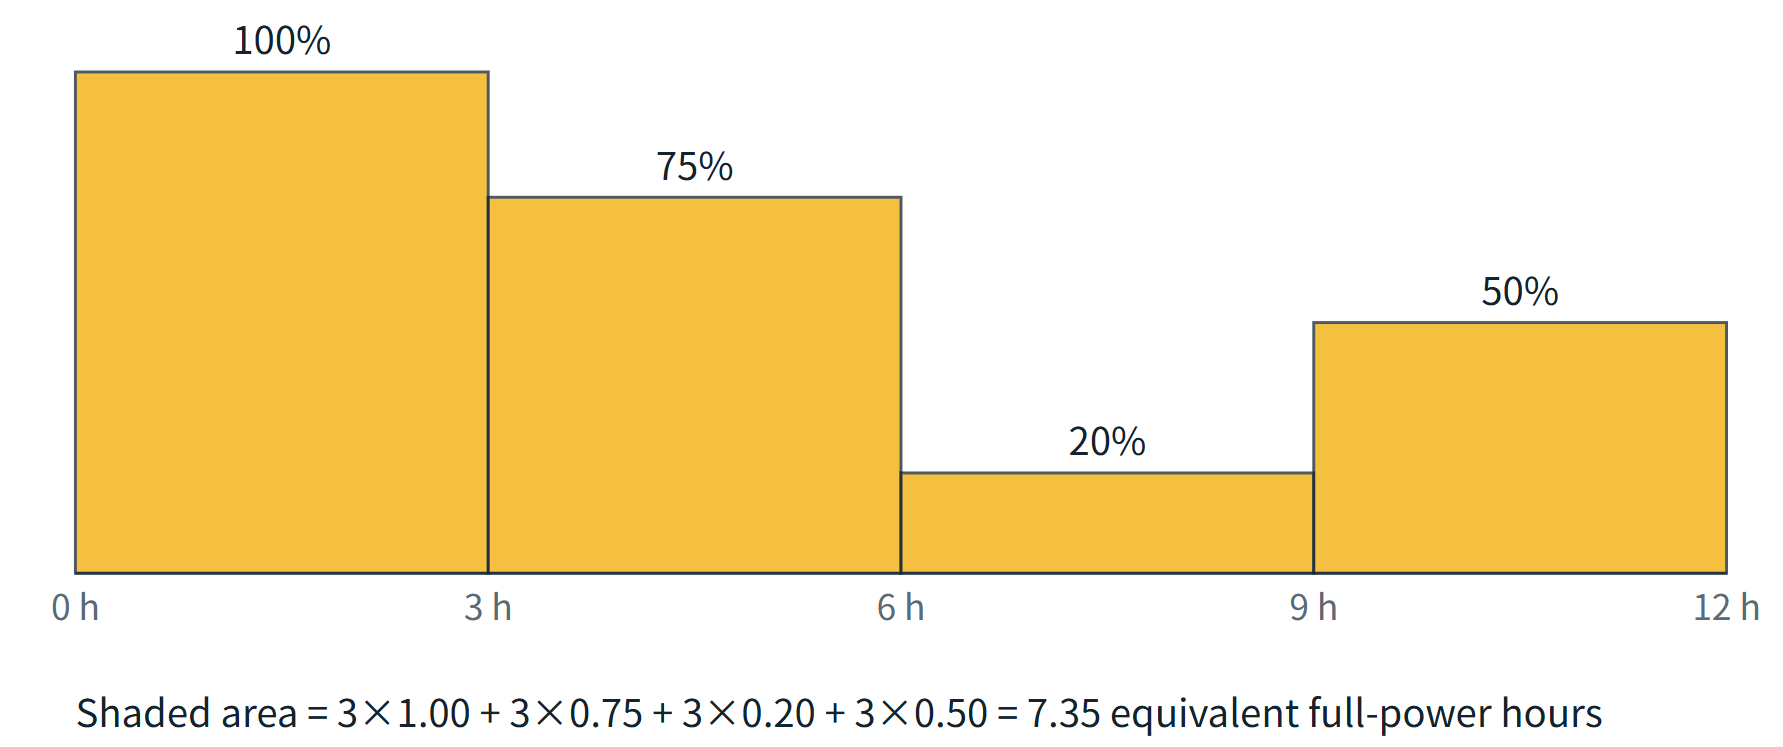
Convert a dimming schedule into equivalent full-power hours: T_eq = Σ (hours × output fraction).
| Period | Hours | Output | Equivalent |
|---|---|---|---|
| Total | 12 | 7.35 h | |
| Evening | 3 | 100% | 3.00 h |
| Late evening | 3 | 75% | 2.25 h |
| Midnight | 3 | 20% | 0.60 h |
| Pre-dawn | 3 | 50% | 1.50 h |
E = (P × T_eq + E_aux) ÷ η_dis
E_aux is extra load (controller, sensors), here 12 Wh/day. η_dis is battery-to-load efficiency, here 0.95. For the 40 W lamp: (40 × 7.35 + 12) ÷ 0.95 = 322.1 Wh/day.
PIR profiles. What matters is total time at full power per night, not one trigger's length. A 60 W lamp with 18 W standby and a design ceiling of 25% of a 12 h night at full power has T_eq = (18 × 9 + 60 × 3) ÷ 60 = 5.7 h, so E = (60 × 5.7 + 12) ÷ 0.95 = 372.6 Wh/day. The 25% share is an assumption; recalculate if traffic is heavier. A 12 h profile also does not cover the longest winter night at every latitude.
3. Select worst-month sun hours
Use the lowest month, not the annual average. For a fixed panel, use global tilted irradiation (GTI) at the planned tilt and orientation from the Global Solar Atlas, and assess shading separately. Round the worst-month value down to 0.1 to get the design value H.
| Site | Worst month | GTI (kWh/m²/day) | Design H | Fixed tilt |
|---|---|---|---|---|
| Dakar, Senegal | August | 5.31 | 5.3 | 16°, south |
| Villahermosa, Mexico | January | 4.48 | 4.4 | 17°, south |
| Santiago, Chile | June | 3.52 | 3.5 | 28°, north |
Long-term modeled averages (data layer v2.2.68, retrieved 15 October 2026), not forecasts. Recheck them for the exact coordinates and current layer before using them in a proposal. GTI already includes the tilt, so do not multiply by a second solar-resource factor. Apply one PV-to-battery efficiency, η_pv = 0.80. Design-day stored energy is G = P_pv × H × η_pv.
4. Size the panel around recovery
A panel that balances a clear day may not refill the battery after cloudy nights. Compute three lower bounds and take the largest. N is autonomy nights, T the target recovery days, and α the assumed fraction of clear-day input on a weak-light day (0.20 here, a scenario assumption).
| Bound | Formula | Dakar (N=3, T=3) |
|---|---|---|
| Daily balance | E ÷ (H × η_pv) | 76.0 W |
| Weak-light recovery | E × (T + N) ÷ [(T + Nα) × H × η_pv] | 126.6 W |
| Zero-charge recovery | E × (1 + N ÷ T) ÷ (H × η_pv) | 151.9 W |
The largest is 151.9 W. Add a 10% margin (about 167 W) and round up to the next 50 W step: 200 W. Daily balance alone would have suggested a panel less than half that size.
5. Size the LiFePO₄ battery
For a conservative autonomy check, assume no charging during the N nights.
C_min = N × E ÷ (V × DoD × k_cap)
With 12.8 V, DoD 80% and a 90% capacity factor: 3 × 322.1 ÷ (12.8 × 0.80 × 0.90) = 104.9 Ah. Add a 10% margin and round up to a 10 Ah step: 120 Ah. Limiting DoD (80% here) protects cycle life, but manufacturers quote cycle life at a stated DoD, temperature and charge rate, so check the datasheet figure at your DoD rather than relying on a headline number. The derating factor is an assumption. Temperature, ageing and manufacturer limits change usable capacity, so confirm that the pack, cells and BMS support the required current.
6. Check depth of discharge and recovery
Weak light: daily loss D = max(0, E − αG), peak discharge E_peak = E + (N − 1) × D. Zero charge: peak discharge = N × E. Peak DoD is each peak divided by C × V × k_cap. With clear-day surplus S = G − E, net recovery is:
T_weak = N × D ÷ S T_zero = N × E ÷ S
Why a weak-light case at all? Under cloud a panel still receives diffuse light, so output is rarely zero, and sizing for zero sun alone tends to oversize the battery. How much light arrives depends on cloud thickness and site, so α = 0.20 is a design scenario, not a measurement. The zero-charge case stays as the conservative check, and the design must pass both.
Timeline assumed. The battery is full at the first sunset, and the cloudy spell lasts N day-night cycles (night 1, a weak-light day, night 2, and so on through night N and one more weak-light day). Clear-day recovery starts after that. The two formulas describe two different moments. Peak discharge E_peak is the lowest charge, at the end of night N, before the last weak-light day's charging. The deficit to recover is what remains after that day's charging, N × D (since E_peak − αG = N × D when D is positive). With zero charge both equal N × E. DoD is judged at the peak, recovery from the deficit at the start of recovery. During recovery the light keeps running and each clear day adds S. This is an energy balance, not an hourly simulation, and it ignores charge-current limits and state-of-charge-dependent charge acceptance.
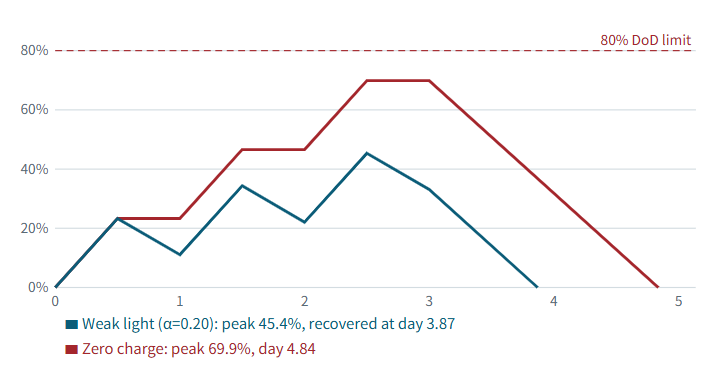
Pass only if S is positive, both recovery times are within T, and both peak DoD values are within 80%. These are energy-balance scenarios, not hour-by-hour simulations or a promise of sunny days. Stress-test with 10% lower clear-day input: N × E ÷ (0.9G − E).
7. Select the MPPT controller
I ≥ 1.25 × P_pv ÷ V_min
Here V_min is the lowest battery voltage at which the controller must still deliver full charge current. Because current = power ÷ voltage, a lower voltage means a higher current. 10 V is a conservative planning value for a 12.8 V LiFePO₄ pack, near the low end of its operating range. Scale it with the battery voltage (about 2.5 V for a 3.2 V pack, 10 V for 12.8 V and 20 V for 25.6 V) and replace it with the real low-voltage limit from the battery and BMS datasheets. For 200 W and 10 V: 1.25 × 200 ÷ 10 = 25 A, so a 30 A class controller is a first choice. This is a screening estimate, not a selection rule. The controller's rated output current, the battery's maximum charge current and the BMS thresholds from the datasheets decide. Also check maximum PV input voltage, cold-weather Voc, hot Vmp, Isc, maximum PV power, battery-chemistry settings and cooling on its datasheet. Panels sized for recovery are large, so also check dimensions, weight, wind load and brackets. A split or semi-integrated structure is likely.
| Panel (Vmp) | LiFePO₄ battery | Typical use |
|---|---|---|
| 6 V | 3.2 V (1S) | Small all-in-one lights |
| 18 V | 12.8 V (4S) | Medium-power projects |
| 36 V | 25.6 V (8S) | Higher-power lights |
Match the panel voltage to the battery system voltage, then confirm the exact window against the controller datasheet.
8. Worked example and three-city comparison
The full chain for the Dakar 40 W case, step by step:
| Input | Value |
|---|---|
| Location and tilt | Dakar (14.69° N), 16° facing south |
| Design sun hours H | 5.3 h/day (August GTI 5.31, rounded down) |
| Luminaire | 8,000 lm at 200 lm/W = 40 W |
| Profile | 12 h dimming, T_eq = 7.35 h, extra load 12 Wh/day |
| Efficiencies and scenario | η_pv 0.80, η_dis 0.95, α 0.20 |
| Autonomy and target | 3 nights, recovery within 3 days |
| Battery | 12.8 V LiFePO₄, DoD limit 80%, capacity factor 0.90 |
| Margins and steps | PV +10% in 50 W steps; battery +10% in 10 Ah steps |
| Item | Calculation | Result |
|---|---|---|
| Battery-side energy E | (40 × 7.35 + 12) ÷ 0.95 | 322.1 Wh/day |
| PV bound: daily balance | 322.1 ÷ (5.3 × 0.80) | 76.0 W |
| PV bound: weak-light recovery | 322.1 × 6 ÷ (3.6 × 5.3 × 0.80) | 126.6 W |
| PV bound: zero-charge recovery | 322.1 × 2 ÷ (5.3 × 0.80) | 151.9 W |
| Selected panel | 151.9 × 1.1 = 167 W, next 50 W step | 200 W |
| Clear-day input G | 200 × 5.3 × 0.80 | 848.0 Wh/day |
| Clear-day surplus S | 848.0 − 322.1 | 525.9 Wh/day |
| Battery minimum | 3 × 322.1 ÷ (12.8 × 0.80 × 0.90) | 104.9 Ah |
| Selected battery | 104.9 × 1.1 = 115.3 Ah, next 10 Ah step | 120 Ah |
| MPPT current | 1.25 × 200 ÷ 10 = 25 A, next 10 A step | 30 A class |
Check against the derated battery energy, 120 × 12.8 × 0.90 = 1,382.4 Wh:
| Case | Net daily loss | Peak discharge | Peak DoD | Net recovery |
|---|---|---|---|---|
| Weak light (α = 0.20) | D = 322.1 − 0.2 × 848.0 = 152.5 Wh | E + 2D = 627.1 Wh | 45.4% | 3 × 152.5 ÷ 525.9 = 0.87 days |
| Zero charging | none | 3 × 322.1 = 966.3 Wh | 69.9% | 966.3 ÷ 525.9 = 1.84 days |
Both cases pass the limits of 80% DoD and 3 days. If clear-day input falls 10%, zero-charge recovery rises to 2.19 days. Same method, four cases:
| Case | Panel | Battery | MPPT | Weak recovery | Zero recovery | Zero peak DoD |
|---|---|---|---|---|---|---|
| Dakar, 40 W, 3 nights | 200 W | 120 Ah | 30 A | 0.87 d | 1.84 d | 69.9% |
| Villahermosa, 40 W, 2 nights | 200 W | 80 Ah | 30 A | 0.95 d | 1.69 d | 69.9% |
| Santiago, 60 W PIR, 2 nights | 250 W | 90 Ah | 40 A | 1.42 d | 2.28 d | 71.9% |
| Dakar, 40 W, 2 nights | 150 W | 80 Ah | 20 A | 1.24 d | 2.05 d | 69.9% |
Going from two cloudy nights to three raises the Dakar battery from 80 to 120 Ah (+50%) and the panel from 150 to 200 W (+33%), so autonomy is a direct cost lever. Choose three only where local weather, the road's criticality or hard maintenance access justify the extra reserve. Santiago needs the largest panel because its worst month has only 3.5 sun hours, even with PIR control. With 10% lower clear-day input, zero-charge recovery rises to 2.19, 2.07, 2.90 and 2.57 days, so Santiago has the least reserve.
Common sizing mistakes
- Using annual-average sun instead of worst-month data.
- Using the wrong tilt or orientation, or counting the solar-resource loss twice.
- Using rated watts or optimistic efficacy instead of measured DC input power.
- Ignoring controls, auxiliary loads and discharge losses.
- Checking daily balance but not recovery time.
- Fixing an undersized panel only with a bigger battery.
- Assuming 100% DoD or rated capacity with no derating or margin.
- Ignoring shade, dust, salt mist, temperature, winter night length, wind load, cable losses and the real BMS and controller limits.
Frequently asked questions
How many cloudy nights should I design for a solar street light?
Two to three are common starting points. The right number depends on local weather, road importance, maintenance access and acceptable outage risk. In the Dakar example, three nights need 200 W and 120 Ah, while two nights need 150 W and 80 Ah.
Why check a zero-charge case if cloudy days still produce some power?
The weak-light fraction is an assumption, not a measured guarantee. The zero-charge case tests a more severe spell, and the design must pass both.
What happens if my solar energy balance is negative, or only slightly positive?
If clear-day input is below the daily load, the battery never refills and the light eventually cuts out. If the surplus is positive but small, recovery takes so long that the next cloudy spell can arrive before the battery is full. Increase panel power, reduce load or dimming hours, or revisit the autonomy target.
Why choose LiFePO₄ over lead-acid or ternary lithium for outdoor solar lights?
LiFePO₄ is widely used because it tolerates frequent cycling and has favorable thermal stability among lithium chemistries. Lead-acid is typically limited to shallower discharge and shorter life, so it needs more nominal capacity for the same usable energy. Ternary (NMC) cells usually offer higher energy density but different thermal and life trade-offs. All lithium chemistries have low-temperature charging limits, so compare actual products using manufacturer data.
How do I size the MPPT controller?
Use I ≥ 1.25 × P_pv ÷ V_min as a screening estimate, then confirm rated output current, maximum PV input voltage and power, cold Voc, hot Vmp, Isc, battery charge-current limit and BMS settings on the datasheets.
Need a project-specific design?
Prepare your site location, light output, dimming schedule, autonomy target and equipment datasheets, then request a sizing review from Infralumin.
Source: Global Solar Atlas (World Bank Group / ESMAP / Solargis), GTI and PVOUT layers v2.2.68, retrieved 15 October 2026. Disclaimer: These formulas and examples are standardized engineering estimates, not performance guarantees. Actual projects require verification of climate data, tilt, shading, longest winter night, temperature, dust and salt exposure, wind load, cable drop and the specific battery and controller datasheets.

Zhongshan Lumin Technology Co., Ltd. is a renowned high-tech enterprise specializing in the research, development, and manufacturing of industrial LED lights.
Contact
@2026 Zhongshan Lumin Technology Co., Ltd.